


Let's see How to create a VM in GCP
- Login to https://cloud.google.com/ with your account.
- A default dashboard screen will open
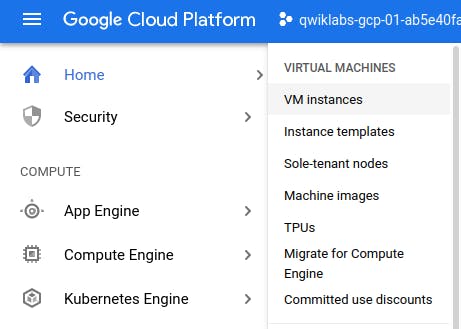
- Go to Navigation menu > Compute Engine > VM instances, then click Create.
OR
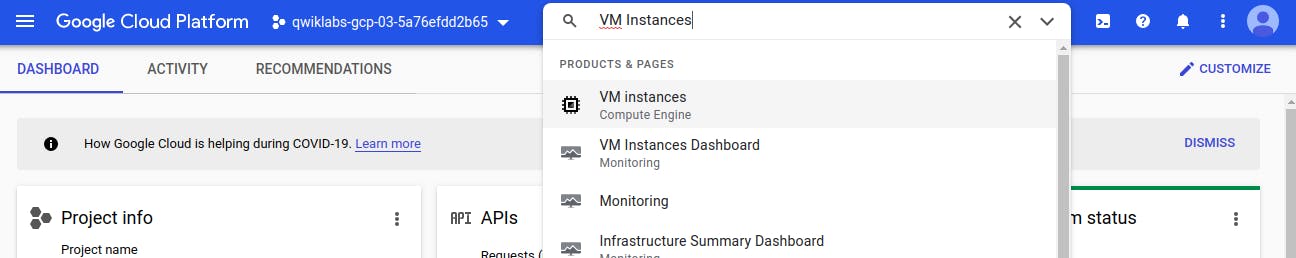
- You can directly search 'VM Instances' in Search bar.
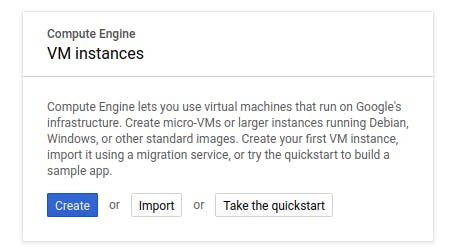
- A window will open, click on 'Create'
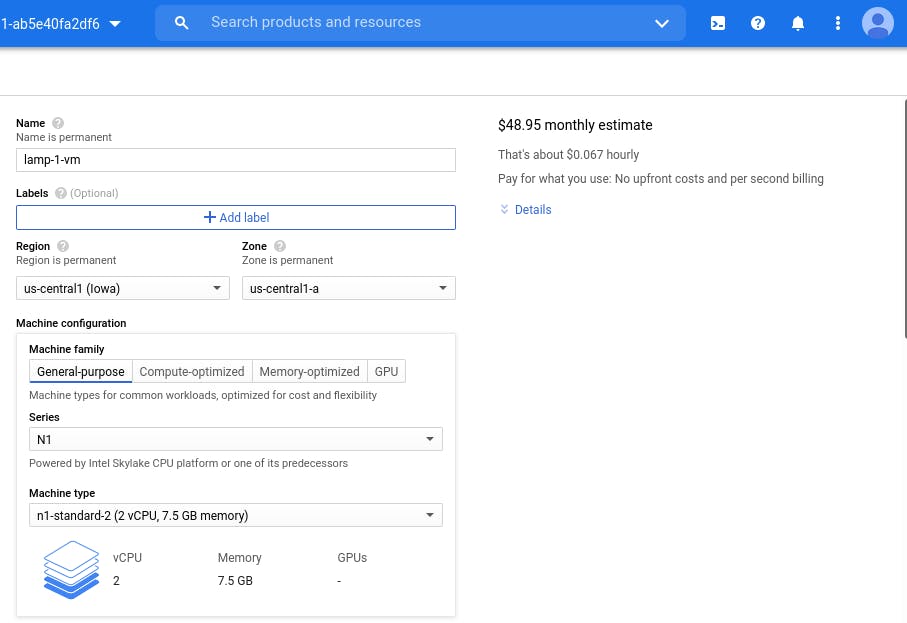
- Fill in the fields as follows, leaving all other fields at the default value: Name lamp-1-vm or (any name you want)
Region us-central1 (Iowa)
Zone us-central1-a
Series N1
Machine type n1-standard-2 (Depend on machine type, cost will change and it will show in Right Hand Side as in fig)
Firewall check Allow HTTP traffic
Allow HTTP Traffic.
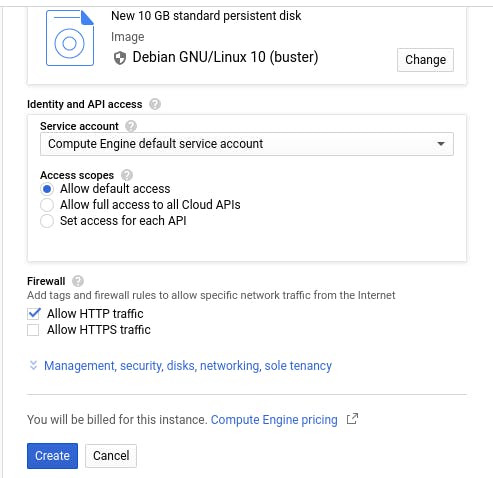
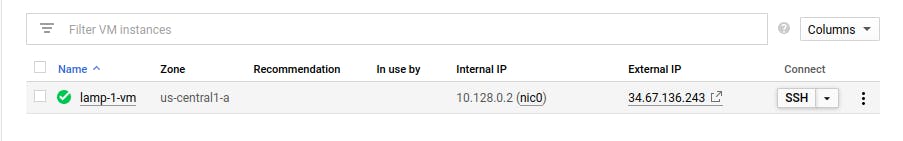
Then click on Create, VM will be created in a few seconds.
The next step is to monitor it with 'Cloud Monitoring'
- Click Navigation menu > Monitoring > Overview
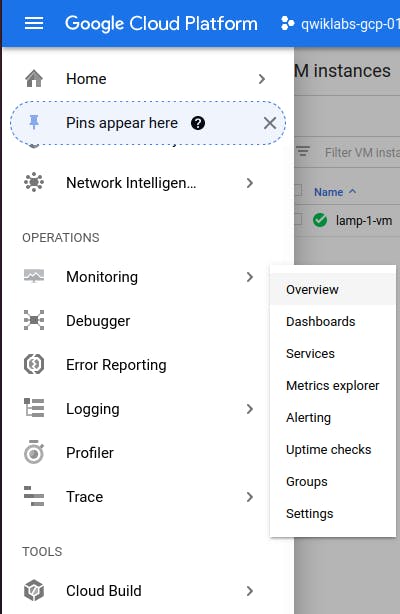
Monitoring comes under the Operation section. I guess it formerly called (Stackdriver) though not 100% sure.
- When the Monitoring dashboard opens, your workspace is ready.
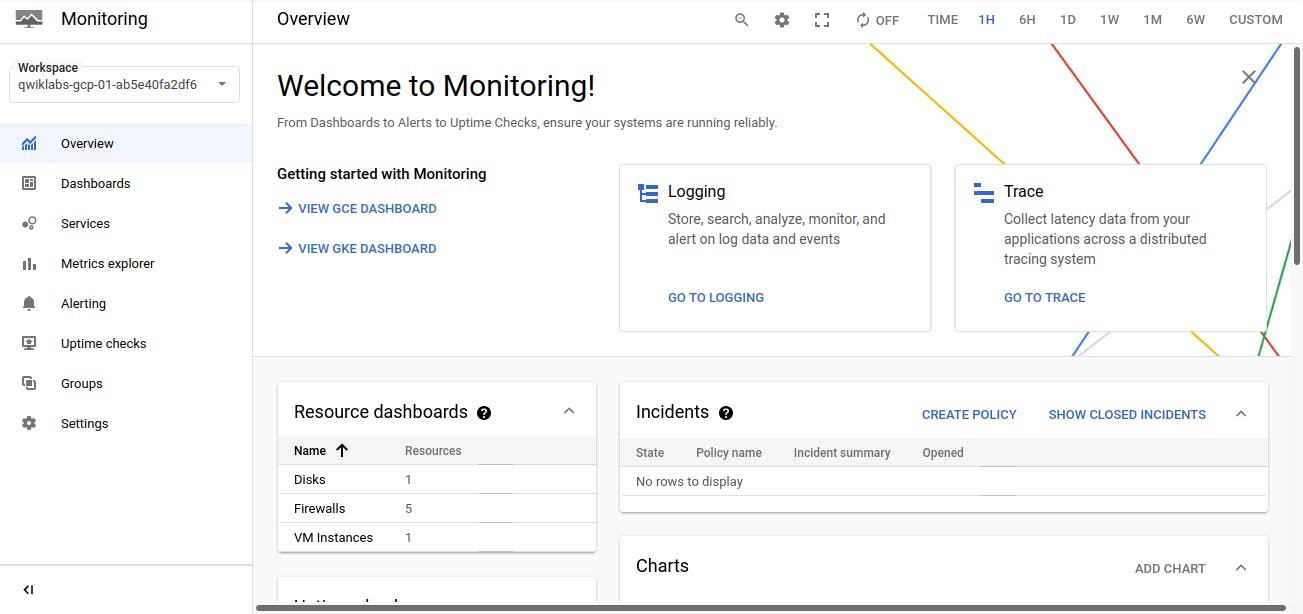
Like in the above image, it shows disk, VM-instances, firewall, and other charts
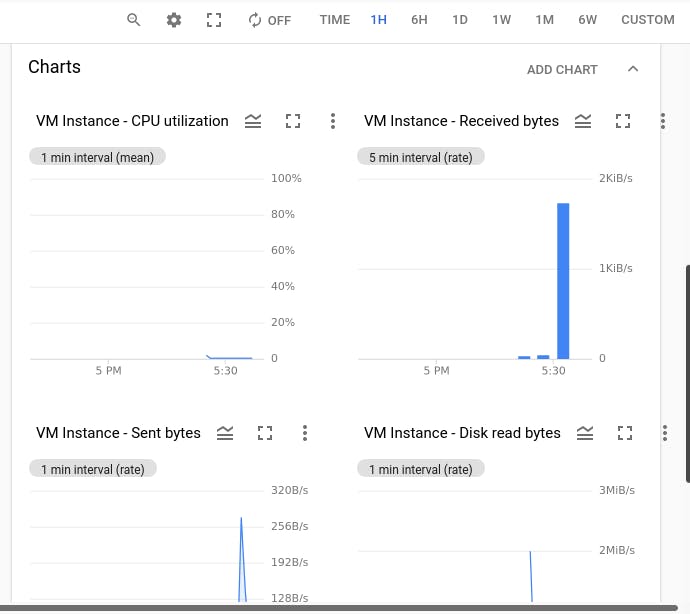
if we click on 'VM Instances' it shows all VM-Instances available in Cloud in this Project.
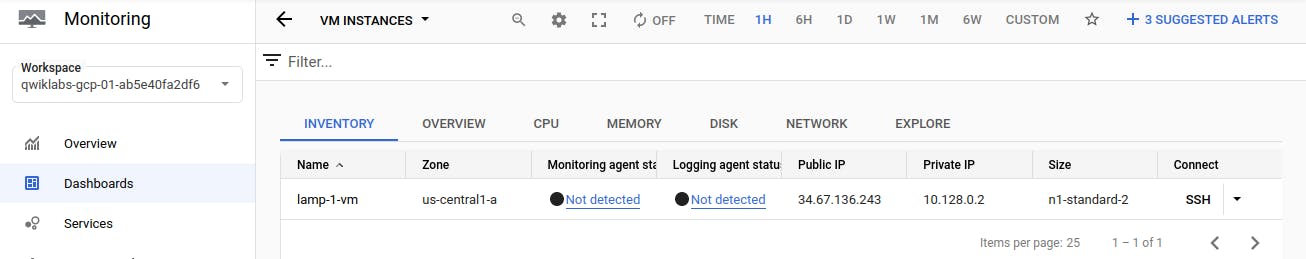
By default, Monitoring can access some instance metrics including CPU utilization, some disk traffic metrics, network traffic, and uptime information.
But what if we want to monitor third-party applications, for example, let's suppose we install apache on VM box.
Click on SSH to connect to VM and run the below command
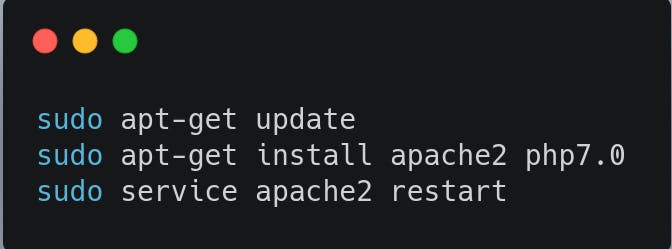
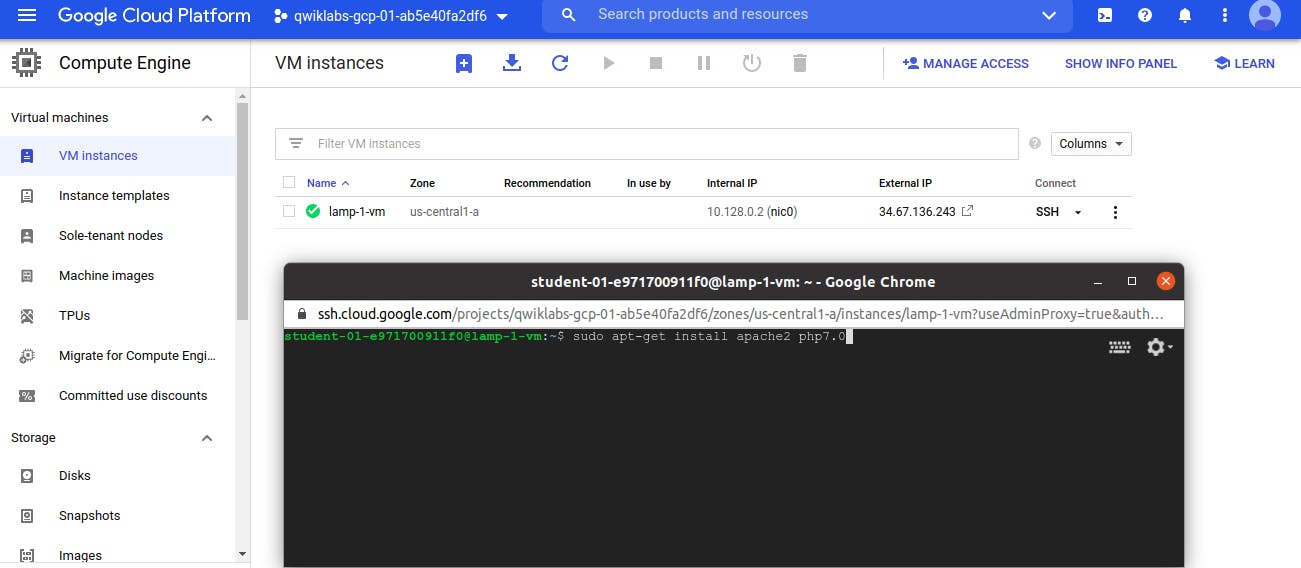
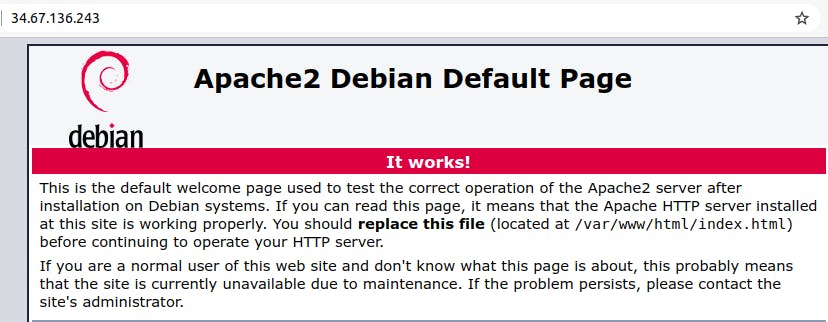
To verify whether the apache server is UP or not.
Click on External IP address shown in VM Instances Screen
 a new window will open as below.
To monitor third-party applications in Cloud Monitoring also other metrics of VM (which not fetch by default) we need to install the Monitoring Agent on VM
To configure the Cloud Monitoring agent to monitor supported third-party applications. The configuration is only possible when the Monitoring agent is running on Linux. The Monitoring agent on Windows monitors IIS and MS SQL applications; however, on these systems, the agent cannot be configured to collect metrics from other third-party applications.
Example of third-party appications:- • Apache web server • JVM Monitoring • Memcached • MySQL • Nginx • Redis • StatsD
Install the monitoring agent using the below commands:-
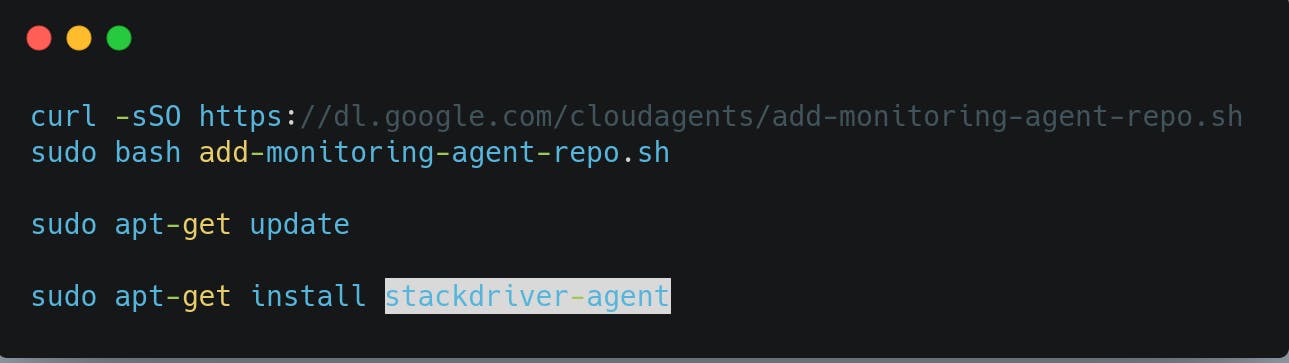 Stackdriver Monitoring agent is used to monitor the VM which is a collectd-based daemon that collects system and application metrics from virtual machine instances. It then sends these metrics to Monitoring. The Monitoring agent by default collects metrics information on disk, CPU, network, and processes.
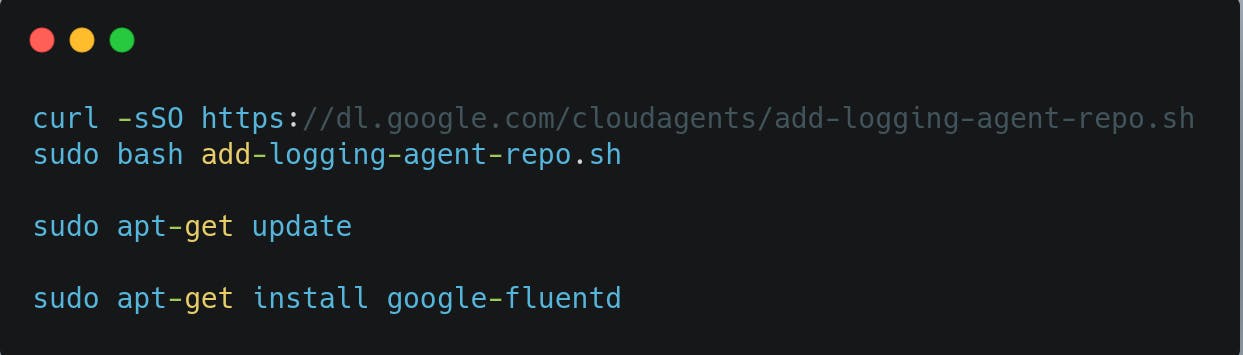
Let's also install the Logging-agent
The Cloud Logging agent to stream logs from your VM instances to Cloud Logging.
Cloud Monitoring and Cloud Logging are closely integrated
google-fluentd is the logging agent.
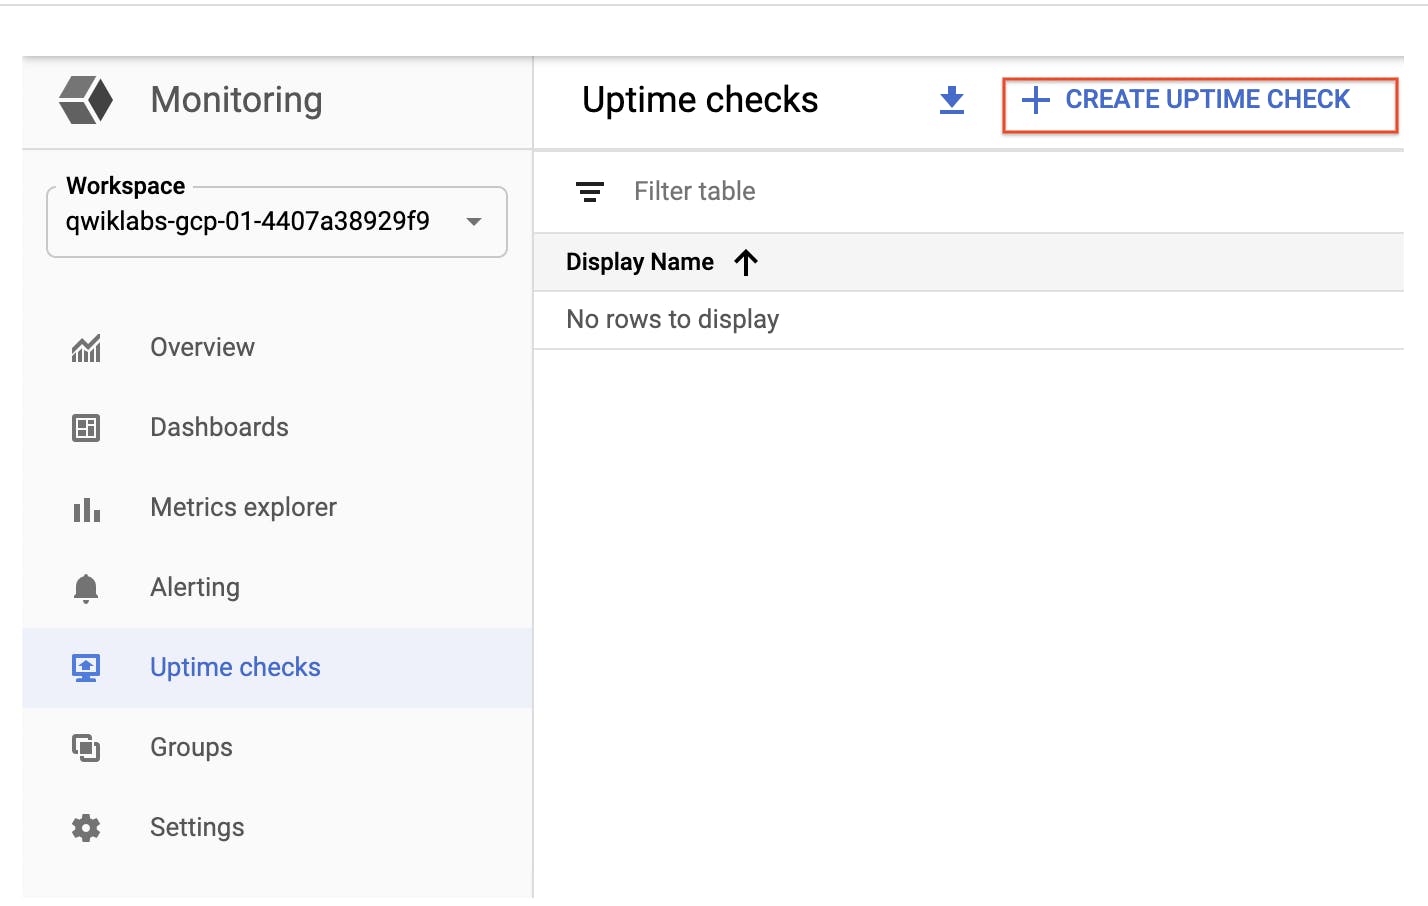
Create an uptime check
Uptime checks verify that a resource is always accessible. For practice, create an uptime check to verify your VM is up.
Set the following fields: Title: Lamp Uptime Check, then click Next.
Protocol: HTTP
Resource Type: Instance
Applies to: Single, lamp-1-vm
Path: leave at default
Check Frequency: 1 min
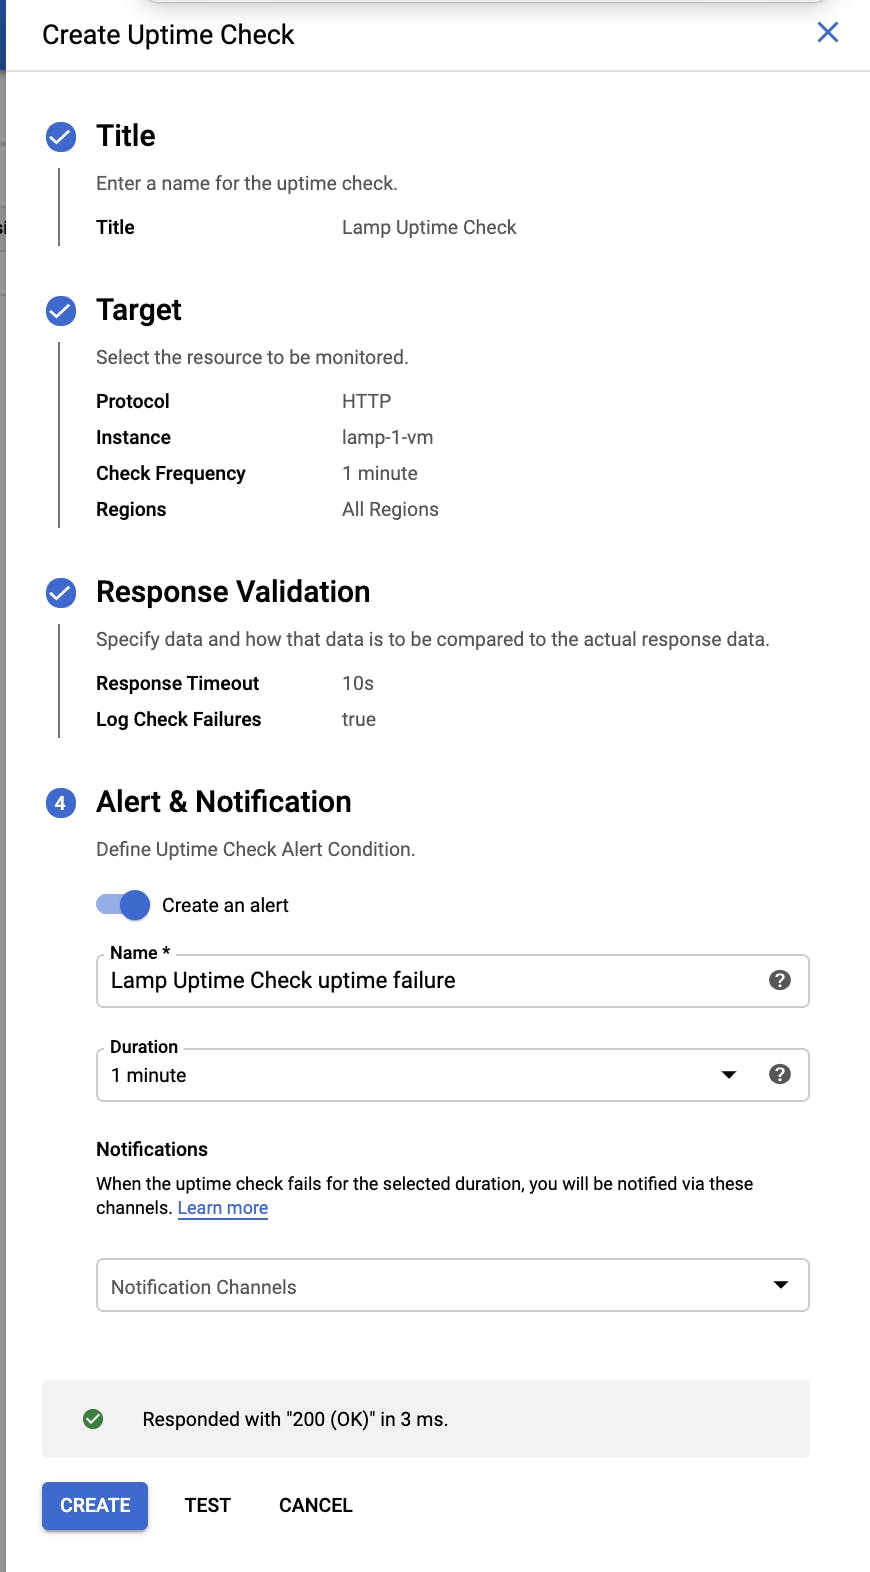 Click Test to verify that your uptime check can connect to the resource.
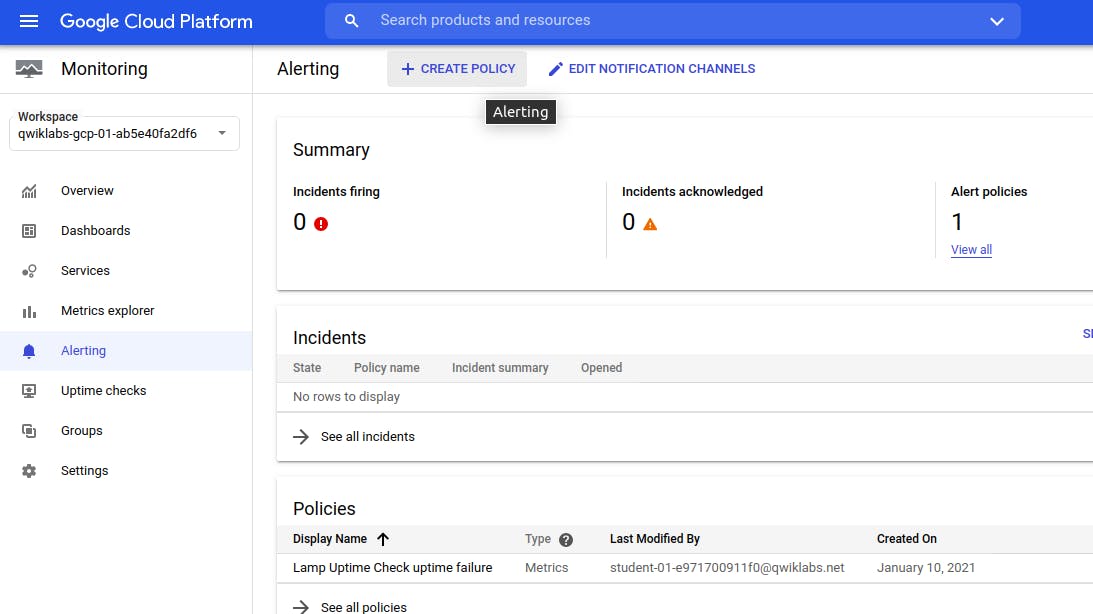
Create an alerting policy
Use Cloud Monitoring to create one or more alerting policies.
In the left menu, click Alerting, and then click Create Policy.
Click Add Condition.
Set the following in the panel that opens, leave all other fields at the default value.
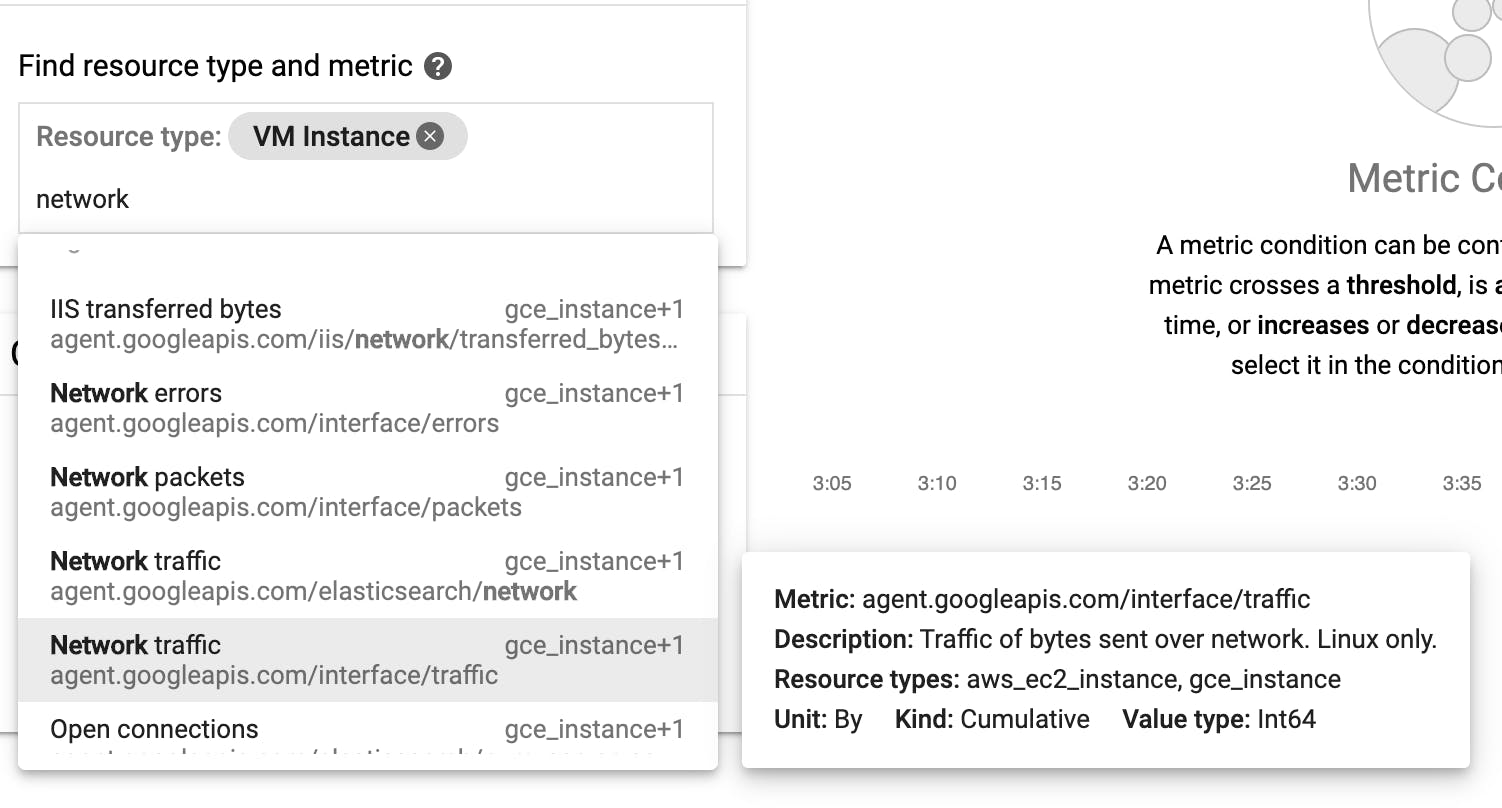
Target: Start typing "VM" in the resource type and metric field, and then select:
Resource Type: VM Instance (gce_instance) Metric: Type "network", and then select Network traffic (gce_instance+1). Be sure to choose the Network traffic resource with agent.googleapis.com/interface/traffic:
Configuration
Condition: is above Threshold: 500 For: 1 minute Click ADD.
Click on Next.
Click on drop down arrow next to Notification Channels, then click on Manage Notification Channels.
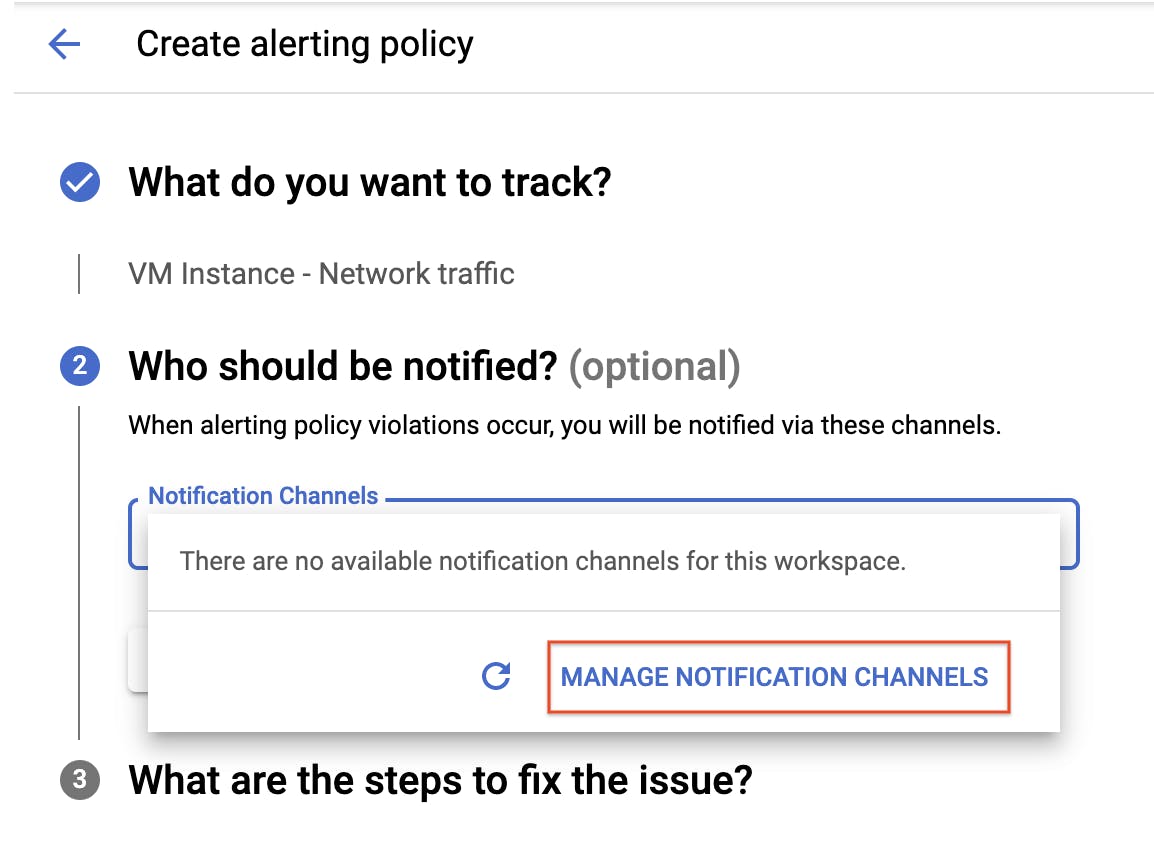
A Notification channels page will open in new tab.
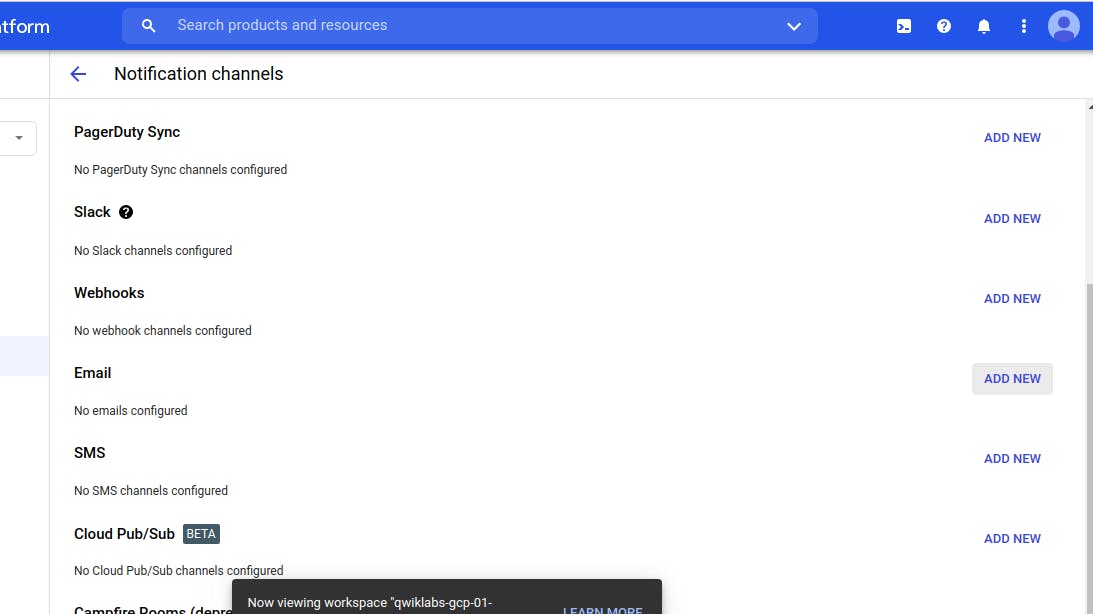
In Create Email Channel dialog box, enter your personal email address in the Email Address field and a Display name.
Click on Save.
Go back to the previous Create alerting policy tab.
Click on Notification Channels again, then click on the Refresh icon to get the display name you mentioned in the previous step.
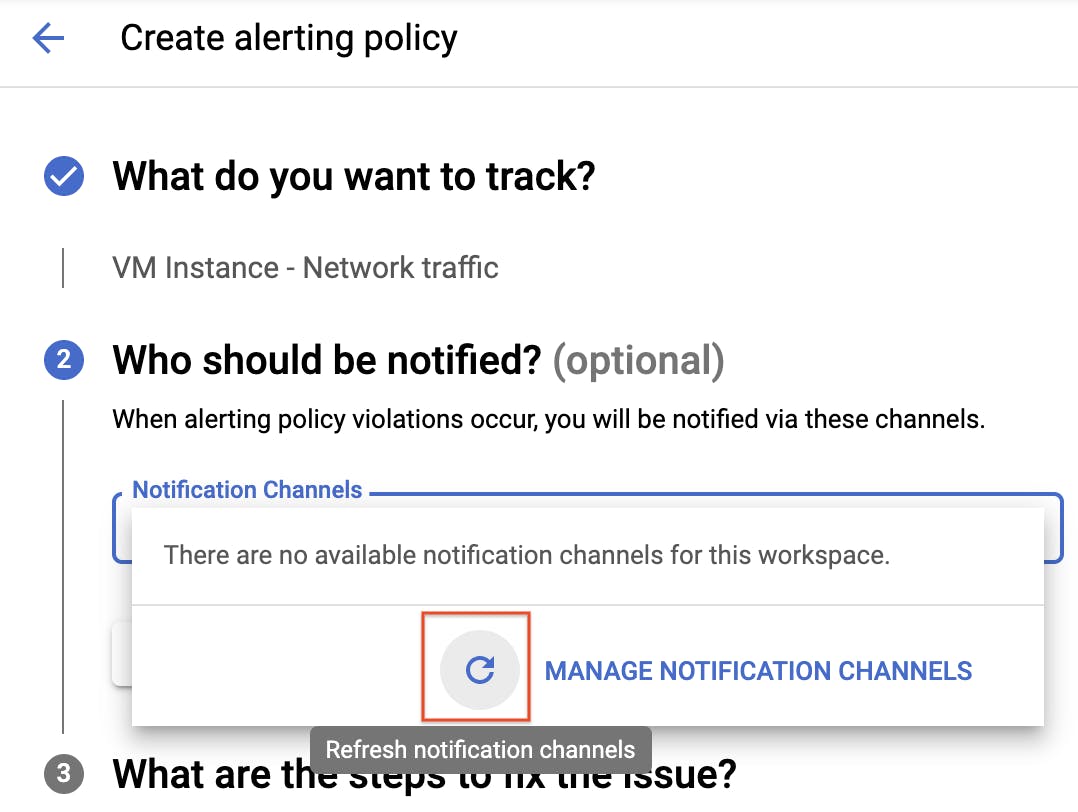
Now, select your Display name and click OK.
Click Next.
Mention the Alert name as Inbound Traffic Alert.
Add a message in documentation, which will be included in the emailed alert.
Click on Save.
You've created an alert!
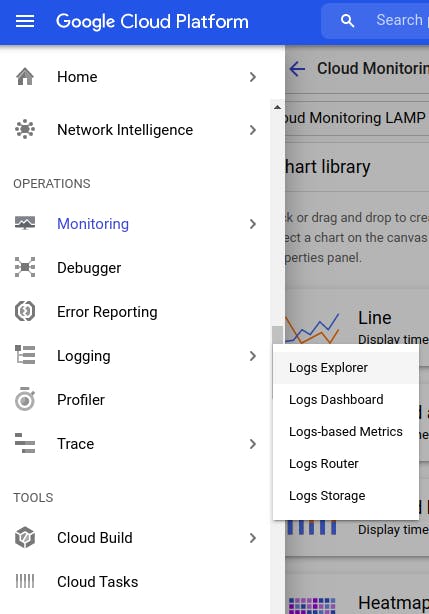
View your logs
Select Navigation menu > Logging > Logs Explorer.
Select the logs you want to see, in this case, you select the logs for the lamp-1-vm instance you created at the start of this lab:
Click on Resource.
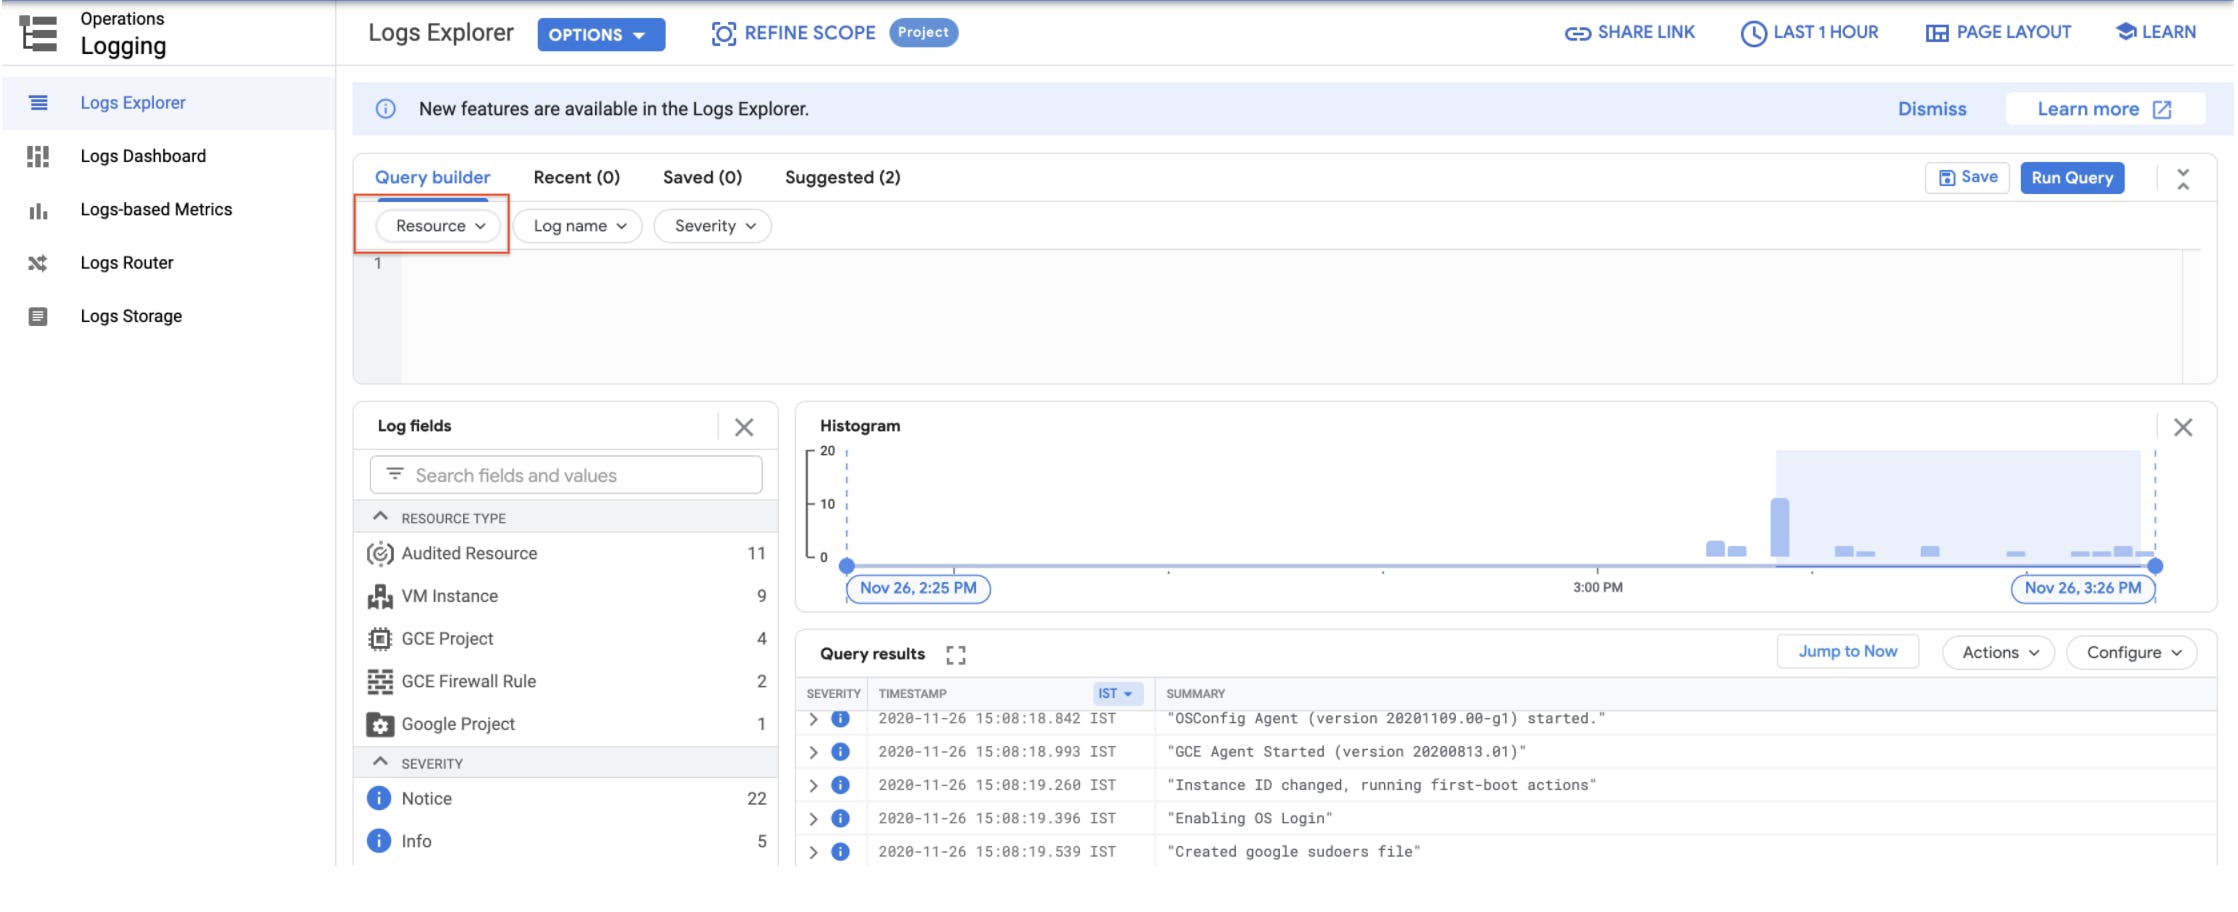
Select VM Instance > lamp-1-vm in the Resource drop-down menu.
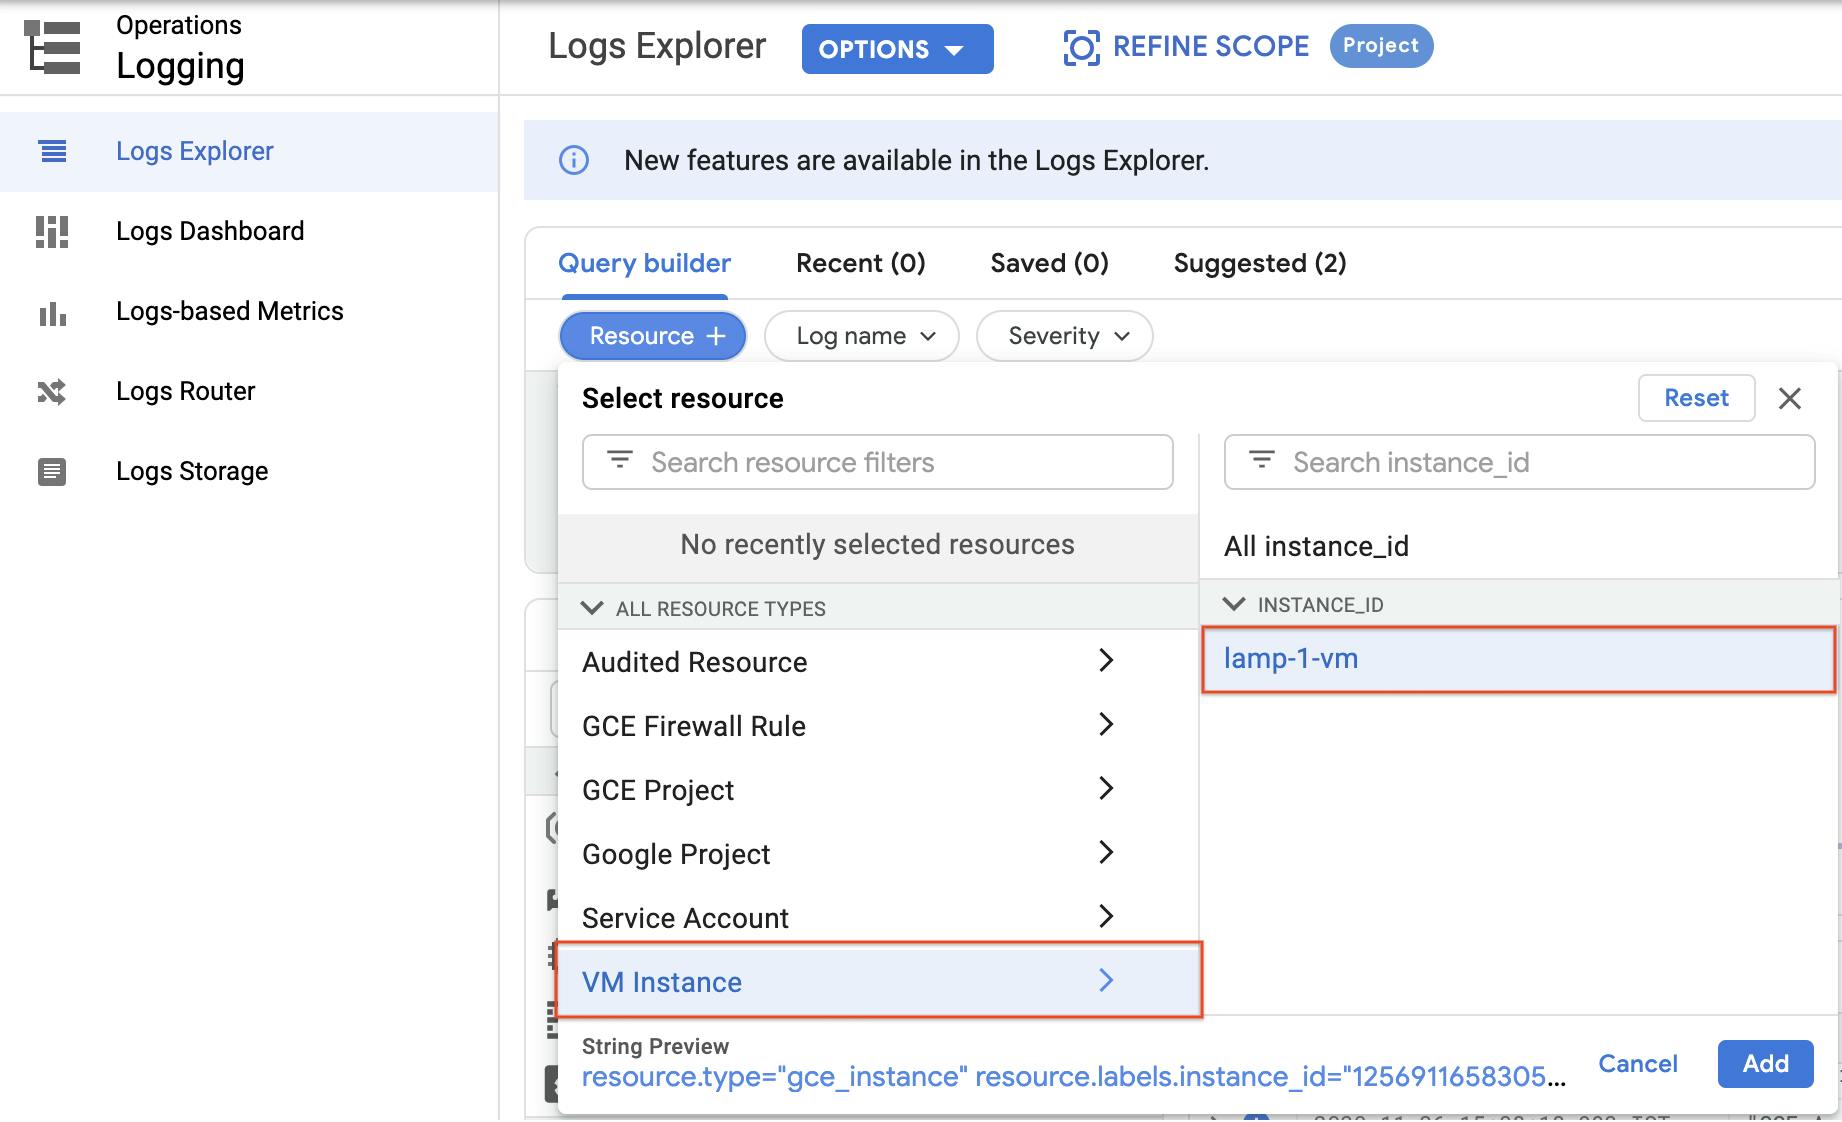
Click Add. Leave the other fields with their default values. Click the Stream logs.
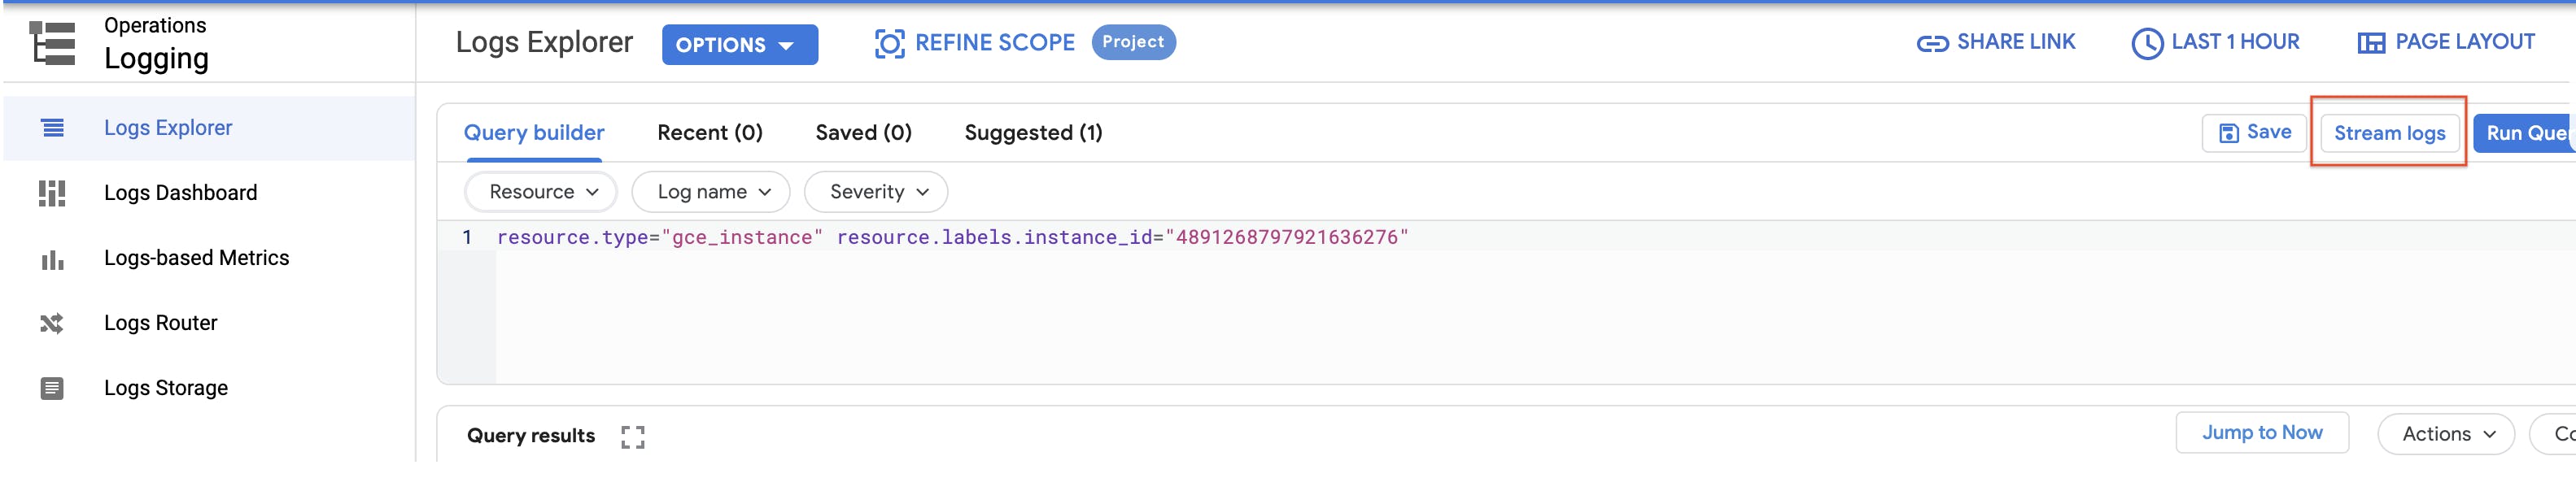
You see the logs for your VM instance:
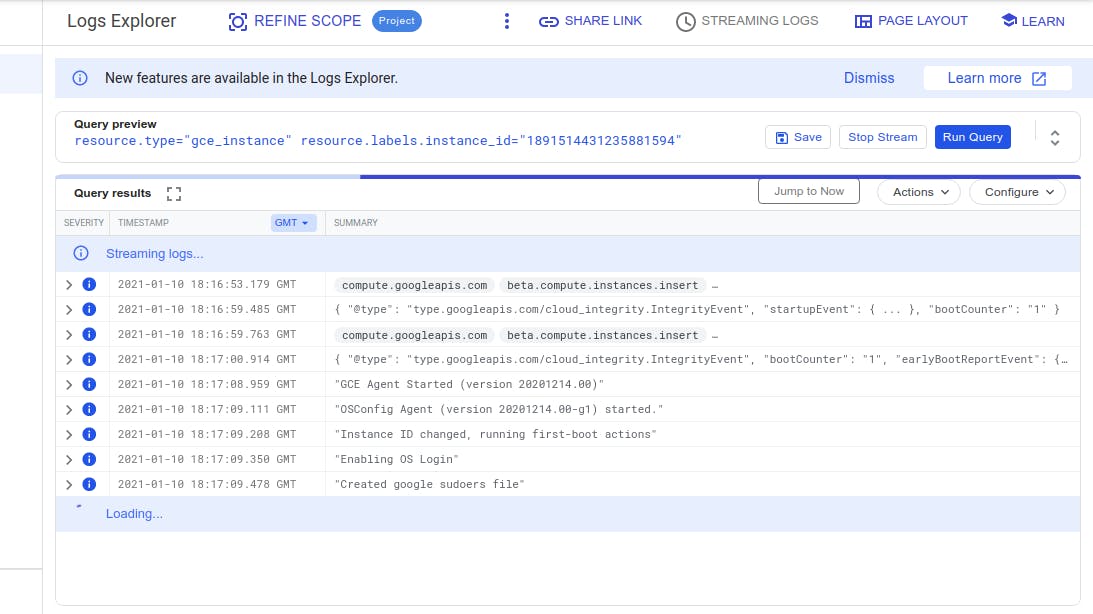
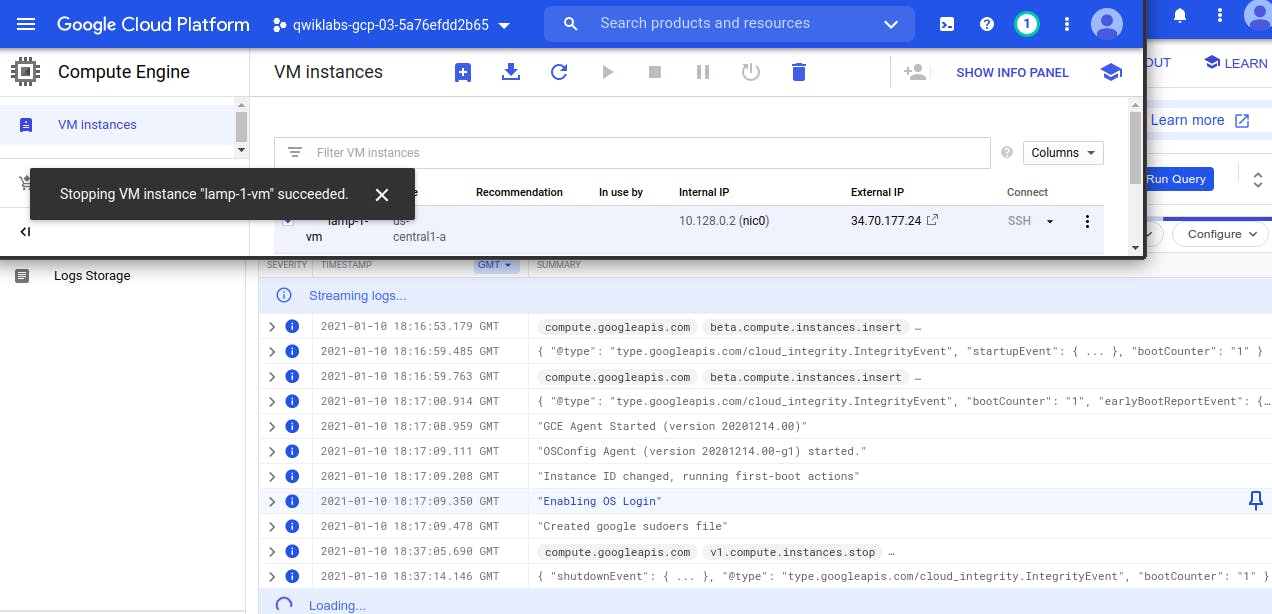
Check out what happens when you start and stop the VM instance.
If we stop the VM instance, same get reflected in logs
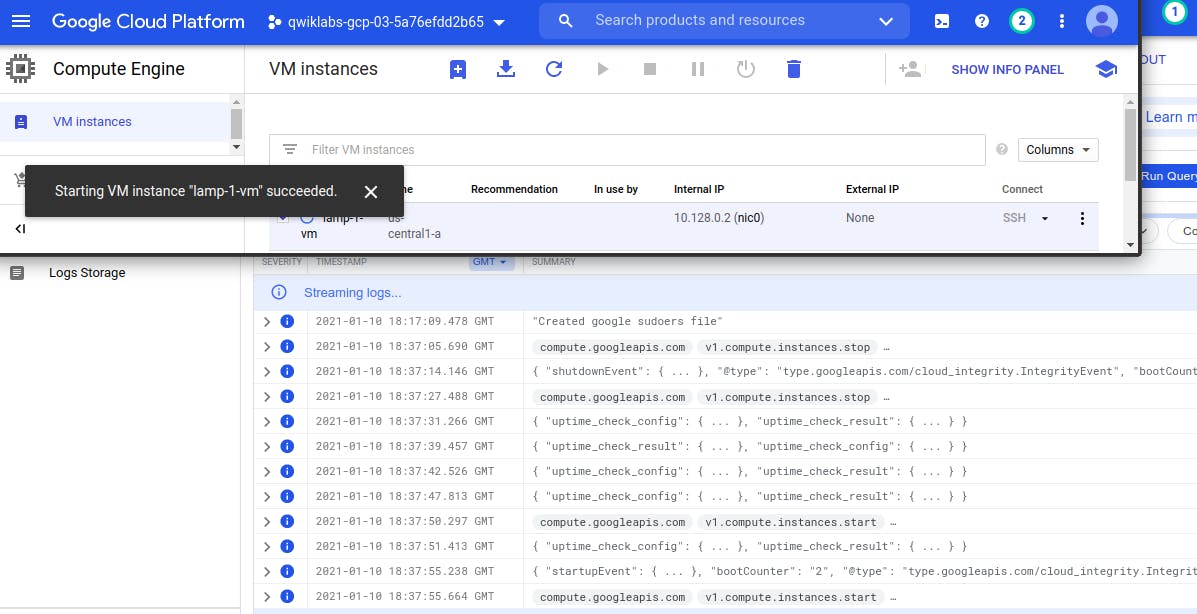
 If we start the VM instance, we see the same in logs.
Check the uptime check results and triggered alerts
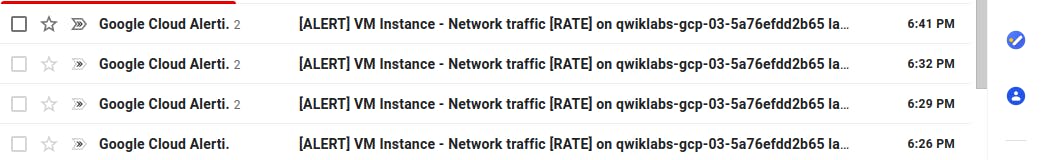
As we created an email alert, So whenwe stopped the VM, we get the alerts in our email box.
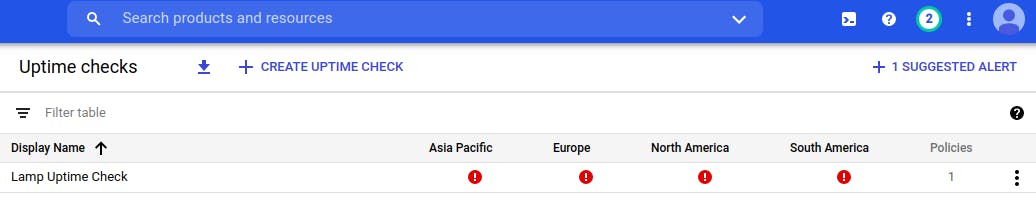
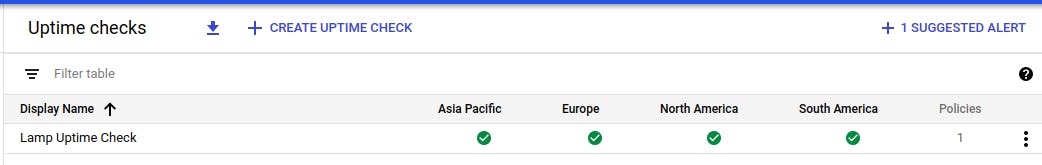
When the VM down, we see all RED mark in Uptime.
 When the VM UP, we see all Green Tick in Uptime.
Resources
https://googlecourses.qwiklabs.com/ - GSP089